← Jing Yang · Home

Teaching

Spring 2027 courses at UNC Charlotte, and research projects open to students for individual study.

Jing Yang, Professor
Woodward Hall 403E
Jing.Yang at charlotte.edu
ITCS 4122/5122 · Visual Analytics

Students learn the broad range of visualization and interaction, then use it on real problems.

Spring 2027 · Wed 4:00–6:45 pm · Main Campus
  • Broad coverageMultidimensional, time, geospatial, trees and graphs, text, trajectories · interactive views · design choices
  • Historical designs to recent advancesExamples from hundreds of years ago to this year.
  • Design, build, evaluate, presentHands-on tutorials in Tableau, Figma, and Vega-Lite; a broad range of evaluation techniques; three presentations per student.
  • From your favorite datasets to real problemsIndividual presentation: you pick the dataset. Group project: build visualizations for domain experts with their data, and get their feedback.
  • AI for Vis, Vis for AIAI that helps author visualizations, and visualization that shows what a model is doing.

Sparse display — don’t filter, highlight

Six sites. Filter to one and there is nothing left to compare it to.
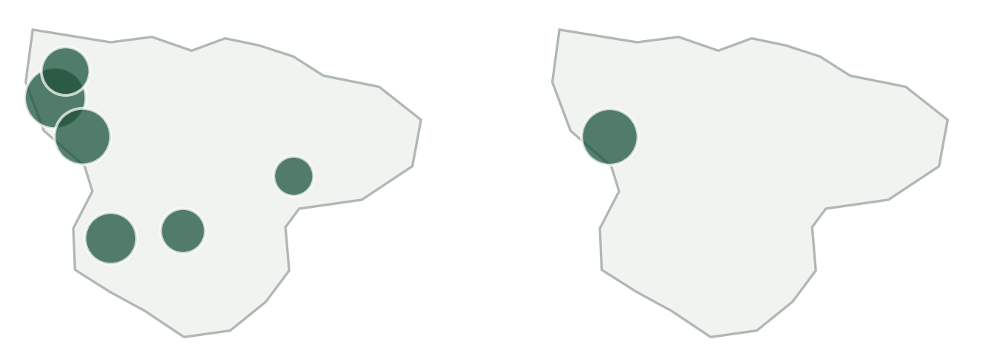
Two maps: six sites shown, then the same map filtered to one site

Cluttered display — filter

96 sites in four groups. Graying the others out does not help; removing them does.
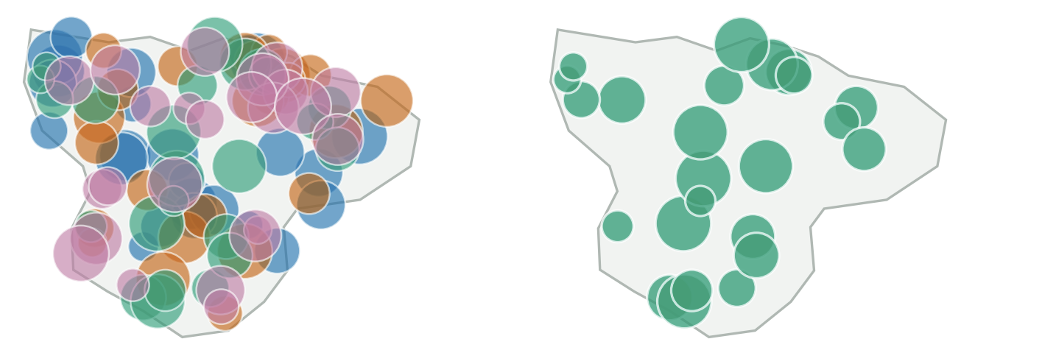
Two maps: 96 overlapping sites in four colors, then filtered to one group

An example of the design choices we discuss in class: when is filtering the right call?
NEW COURSEITCS 4010/5010 · Special Topics: Human–AI Collaborative Analytics

How should humans and AI communicate, reason, adapt, and share control during analytical work?

Spring 2027 · Thu 5:30–8:15 pm · Main Campus
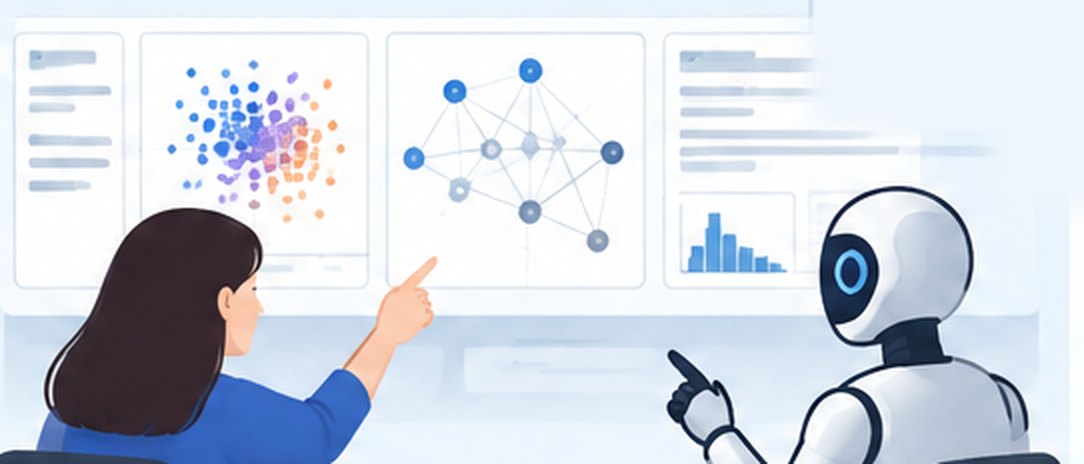
Illustration of a person and an AI robot pointing at shared charts on a large display
Visualization as a shared workspace for humans and AI — a broader communication channel than chat.
  1. CommunicateExchange goals, context, evidence, feedback
  2. ReasonCombine human insight and AI capabilities
  3. AdaptLearn from each other over time
  4. Share controlDecide who steers, who verifies, who decides, and when

Experiment, build, and evaluate.

Individual study · I love working with enthusiastic, hardworking students!

Join a project with me and domain experts

  • MetaboFoodEmploy AI to make our food–compound–disease knowledge graph accessible and useful to researchers and the public.
  • Student success analyticsAnalyze retention risk from academic and engagement data, and turn a prediction into an advisor’s next move, with agentic AI.
  • Privacy-aware visualizationStudy how interactive visualization helps analysts explore sensitive data.
  • Visualization for AIHow to build visualizations that AI can use more effectively.
  • AI for visualizationEnhance visualization systems with literature digested by AI, AI-powered data movies, and more.
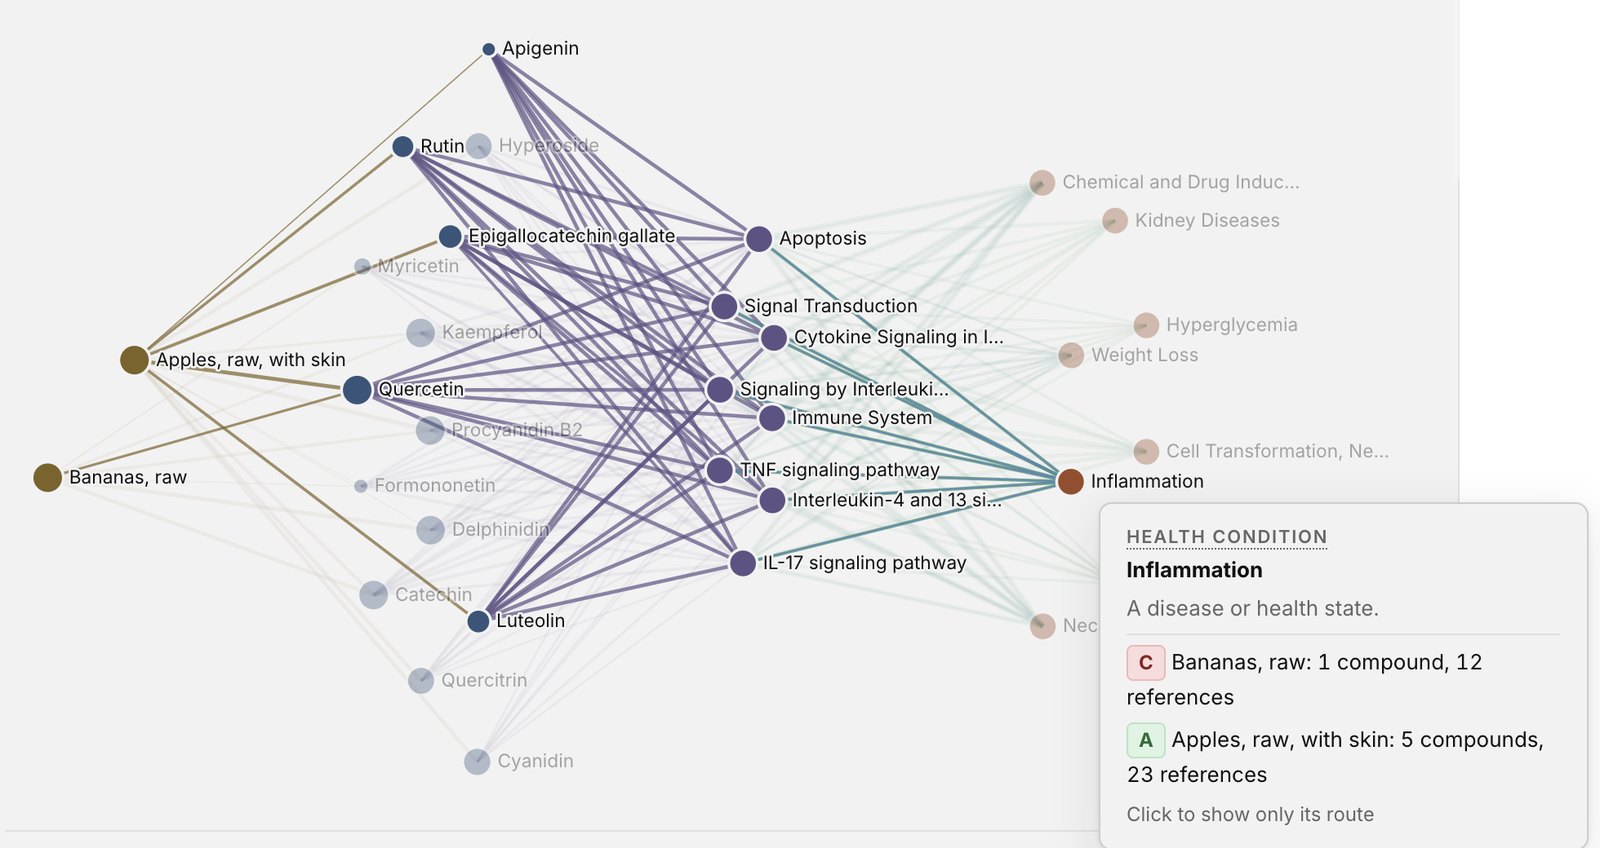
MetaboFood explorer: a network linking foods, compounds, pathways and health outcomes
MetaboFood: Explore measured food composition, then follow evidence-linked molecular relationships through compounds, pathways, and health outcomes. The example is built by a student.
Interested? Email me at Jing.Yang at charlotte.edu or stop by Woodward Hall 403E.